Reporting mode
Reporting mode enables live monitoring of data collection, allowing you to track survey progress and analyze responses in real-time as participants complete your survey.
Overview
This mode provides comprehensive insights into your data collection process, including response distributions, completion rates, and detailed breakdowns by question type. The reporting dashboard offers advanced analytical tools to filter, weight, and visualize your survey data.
Key features
Live data monitoring
- Real-time updates as responses are submitted
- Track survey completion progress
- Monitor response patterns and trends
Advanced analytics
- Filters - Apply conditions to segment and analyze specific response subsets
- Crossover variables - Cross-reference questions to create multidimensional breakdowns
- Raking - Weight your data to match target population characteristics
- Configurations - Save and reuse custom analytical setups
Question type support
You can browse through answers for multiple question types:
- Question Profile - Single and multiple choice questions
- Item Series - Battery of items responses
- Hotspot - Interactive hotspot zone selections
- Open Questions - Text-based responses and feedback
Data visualization

Statistical Analysis
Calculate significances
This option enables statistical significance testing in your reporting, allowing you to determine whether differences between groups are statistically meaningful or could have occurred by chance. When enabled, significant differences are typically highlighted in your cross-tabulation tables, helping you identify which variations in your data are reliable and actionable.
Type of significance
Choose the statistical test appropriate for your data type and research design. Different tests are suited for different scenarios:
ANOVA
Analysis of Variance (ANOVA) is used when comparing means across three or more independent groups. It tests whether there are statistically significant differences between group means. Use ANOVA when:
- You have a continuous dependent variable (e.g., satisfaction scores)
- You're comparing multiple groups simultaneously (3 or more)
- You want to understand if group membership affects the outcome
Welch t-test
The Welch t-test (also called Welch's unequal variances t-test) compares means between two groups without assuming equal variances. This test is more robust than the standard t-test when:
- Comparing two independent groups
- The groups have different sample sizes
- The groups have unequal variances (different spread of data)
- You want to test if two means are significantly different
Z-Test (pooled)
The Z-test with pooled proportions compares proportions between two or more groups. It's commonly used in survey analysis for:
- Comparing percentages or proportions (e.g., "Yes" responses)
- Testing differences in categorical response rates
- Large sample sizes (typically n > 30)
- Binary or categorical outcomes
Threshold % [5; 10]
This sets the significance level (alpha) for your statistical tests, expressed as a percentage. The threshold determines how confident you need to be before declaring a result statistically significant:
- 5% (0.05 alpha): Standard threshold in most research, indicating 95% confidence
- 10% (0.10 alpha): More lenient threshold, useful for exploratory research
A 5% threshold means there's only a 5% chance the observed difference occurred by random chance. Lower thresholds are more conservative and reduce false positives.
The slider allows you to adjust between 0% and 50%, with common values at 5% and 10%.
Appearance and Themes
Graph theme
Select the visual theme for your charts and graphs. Different themes provide distinct color palettes and styling options. For example:
- celticsea: A specific color scheme that may use oceanic or blue-green tones
Themes help maintain visual consistency across your reporting and can be chosen to match your brand or improve readability.
Select the Heatmaps theme
Choose the color scheme used for heatmap visualizations. For example:
- HEAT: A traditional heat-based gradient (typically red-yellow-white or similar)
The heatmap theme affects how intensity values are represented through color, making patterns and hotspots more or less prominent depending on the chosen palette.
Advanced Display Options
Hide the fieldwork KPI section
This option removes the Key Performance Indicators (KPI) section related to fieldwork from your reporting view. The fieldwork KPI section typically shows metrics such as:
- Response rates
- Completion times
- Survey progress statistics
- Data collection milestones
Hide this section when you want to focus on response data rather than collection metrics, or when presenting to audiences who don't need operational details.
Show URL parameters
Enable this to display the URL parameters that respondents used when accessing your survey. URL parameters can include:
- Campaign tracking codes (UTM parameters)
- Custom identifiers
- Source/medium information
- Referral data
This is valuable for understanding how respondents reached your survey and for analyzing responses by traffic source or campaign.
Show hidden questions
This option reveals questions that are normally hidden in the reporting interface. Hidden questions might include:
- Technical variables
- Internal tracking questions
- Questions used for logic/routing only
- Metadata fields
Show hidden questions when you need to analyze or cross-reference these typically invisible elements.
Show the hotspot heatmap
Enable the heatmap visualization for hotspot questions, which displays areas of an image where respondents clicked or selected. The heatmap shows concentration of responses using color intensity, making it easy to identify popular zones and patterns in visual selection tasks.
Heatmap visualization type
Choose how the hotspot heatmap displays response data:
By points
This mode shows individual click points or selections as discrete markers. Each respondent's selection appears as a separate point, allowing you to see:
- Exact click locations
- Clustering of responses
- Individual response patterns
- Outlier selections
Useful when you need to see the raw data and individual variations.
By zones
This mode aggregates responses into predefined zones or areas. Instead of individual points, you see:
- Zone-level statistics
- Aggregated counts per defined area
- Simplified heat visualization
- Pre-categorized regions
Useful when you've defined specific areas of interest and want summarized statistics rather than individual clicks.
Crossover variable displays
Crossover variables support multiple visualization modes:
- Chart and table representations
- Topbox/lowbox analysis for rating scales
- Mean calculations for numerical data
Block visibility control
Display options button in the reporting interface
The reporting dashboard allows you to customize which question blocks are visible using the display options control.
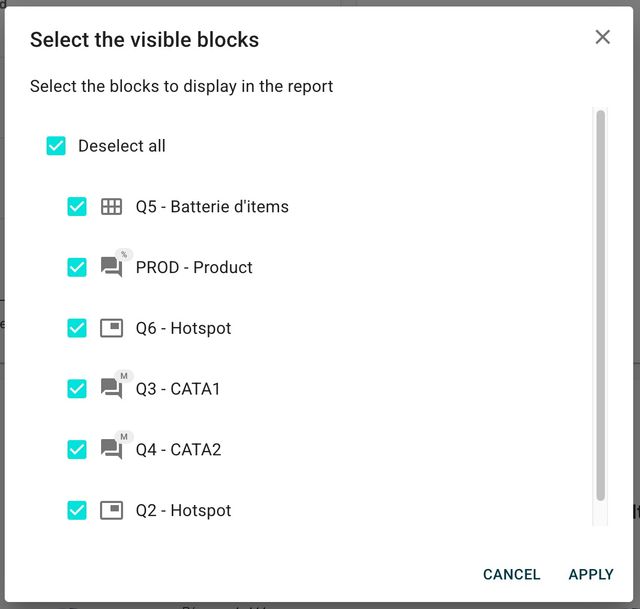
Display options dialog for selecting visible blocks
This control lets you:
- Show or hide specific question blocks
- Focus analysis on relevant survey sections
- Reduce visual clutter in complex surveys
Data tracking
Overall progress tracking
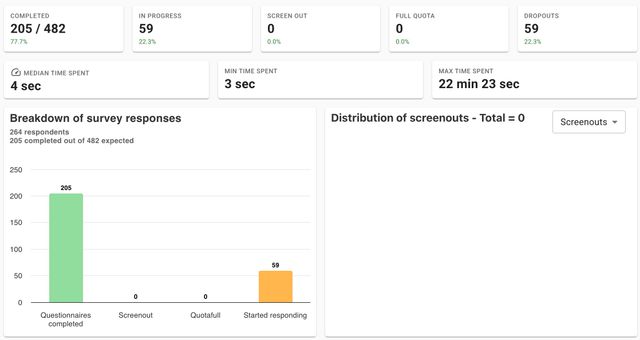
Cell distribution table showing overall survey progress
It is possible to track the progress of cells in the reporting. A cell distribution table shows the overall progress across all survey segments.
Question-level analysis
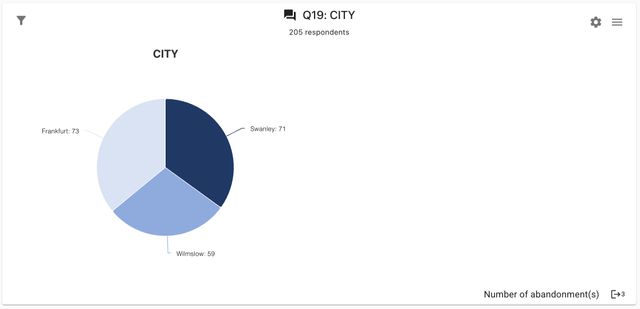
Individual question analysis with cell distribution tables
Under each question, there is also a cell distribution table providing detailed insights into:
- Response frequencies
- Completion rates per question
- Answer distribution patterns
Workflow
To analyze your survey data effectively:
- Apply filters to focus on specific respondent segments
- Set up crossover variables to create multi-dimensional breakdowns
- Configure raking if population weighting is required
- Save your setup as a configuration for future use
- Customize visible blocks using display options
- Export or share your analytical findings
Each analytical feature can be combined to create sophisticated data views tailored to your research objectives.