Filters
Filters let you focus your dashboard analysis on specific subsets of survey responses. You can apply filters globally to the entire dashboard or locally to individual blocks.
Definition
A filter is a condition that restricts which survey responses are included in your dashboard’s data visualizations. Filters can be set for the whole dashboard (global filters) or for a single block (block filters). When filters are active, each affected question displays filter "chips" to show which filters are applied.
When to use
Use filters when you want to:
- Analyze results for a specific group (e.g., a region, product, or time period).
- Compare different segments side by side using separate blocks.
- Exclude irrelevant data from your analysis.
Avoid using too many filters at once, as this may result in tiny or empty datasets.
Key behaviors & constraints
- Global filters affect all blocks in the dashboard.
- Block filters only affect the block where they are set.
- You can combine global and block filters; block filters further narrow down the data.
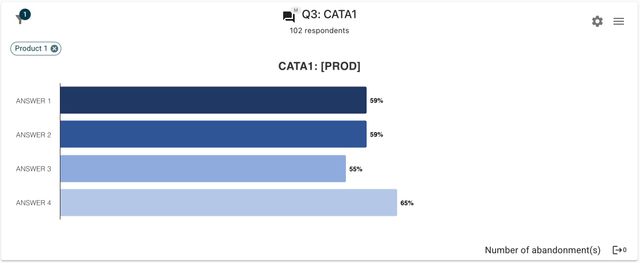
- Filter chips appear next to each filtered question for clarity.
- Filters do not change the underlying survey data—only what is shown in the dashboard.
Configuration
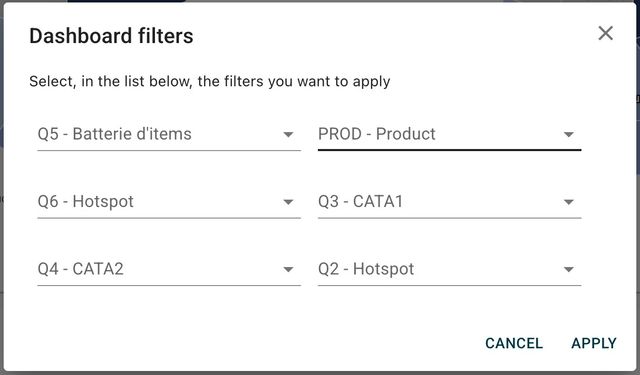
To add or edit filters:
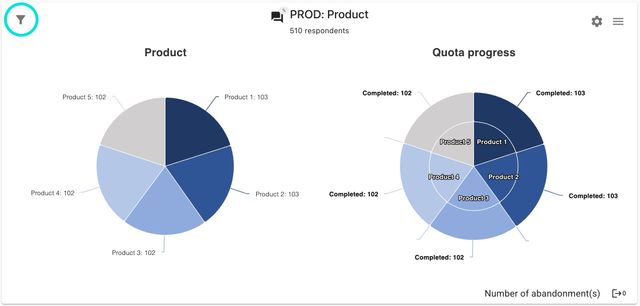
- Global filters: Click the filter icon in the dashboard toolbar to open the global filter dialog.
- Block filters: Click the filter icon in a block’s header to open the block filter dialog.
Examples
- Block filter: In a comparison block, filter one block to "Product A" and another to "Product B" to compare satisfaction.
- Combined filters: Apply a global filter for "Region: Europe" and a block filter for "Age: 25-34" to see only European respondents in that age group for a specific block.