Data visualisation
The Data Visualisation tool provides a comprehensive real-time interface for monitoring and managing individual survey responses, allowing you to view all participant answers as they progress through your survey.
Overview
This powerful tool enables you to monitor ongoing surveys, review completed responses, and make necessary adjustments to participant data while maintaining full visibility into the survey process.
Key features
Real-time response monitoring
View all answers even for ongoing surveys:
- Monitor participants as they complete the survey
- See responses in real-time as they're submitted
- Track completion progress for individual respondents
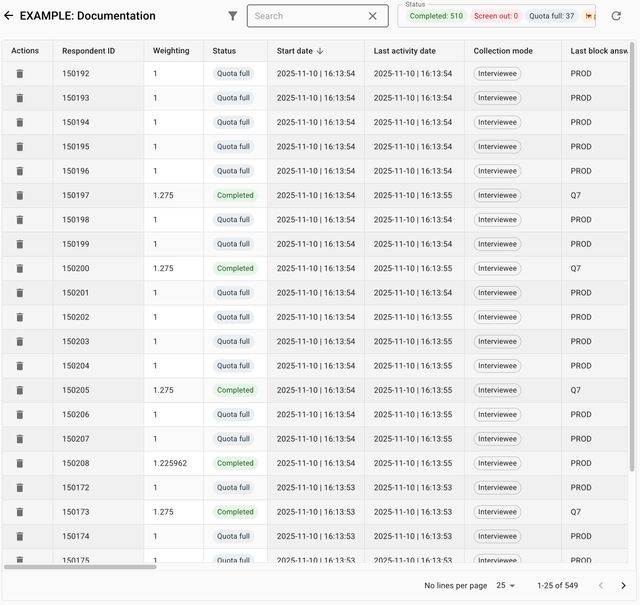
Complete overview of participant responses with real-time updates
Select only blocks that you want to see
Filter the displayed data to focus on specific sections:
- Choose which survey blocks to display
- Hide irrelevant sections for clearer analysis
- Customize the view based on your monitoring needs


Progress tracking
Information about the last answered block:
- Current position in the survey
- Time spent on each section
- Completion status and progress indicators
- Last activity timestamps
Response management
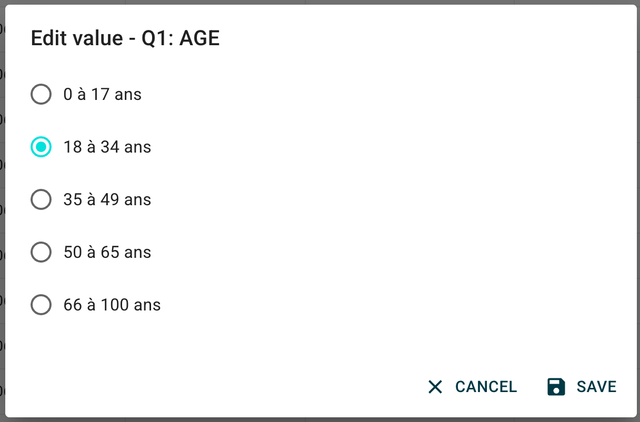
Interface allowing modification of participant responses
You can modify answers of participants:
- Edit individual responses as needed
- Correct data entry errors
- Update responses based on participant feedback
- Make real-time adjustments during data collection
Comprehensive information panel
See all parameters and important information:
- Survey metadata and settings
- Response timestamps and duration
- Device and browser information
- IP addresses and location data
- Survey version and configuration details