Crossover Variable
Crossover variables enable you to analyze how different groups respond to survey questions by selecting one question to cross-reference against all other questions in your dashboard. This produces side-by-side comparisons across categories.
Definition
A crossover variable is a question selected as the basis for comparative analysis across your dashboard. When you choose a crossover variable, each question in the dashboard displays data segmented by the categories of that variable. For example, crossing by "Product" shows how respondents for each product answered every other question.
When to use
Use crossover variables when you need to:
- Compare how different groups (products, regions, departments) respond to the same questions.
- Identify patterns or differences in responses across segments.
- Analyze survey data by a key demographic or categorical variable.
Avoid using questions with too many response options as crossover variables, as this may make visualizations difficult to read.
Key behaviors & constraints
- Only one crossover variable can be active at a time.
- The crossover variable applies to all questions in the dashboard.
- Questions with no valid cross-tabulation data will display a notice.
- The crossover variable itself is not cross-tabulated with other data.
- All statistics and visualizations update automatically when a crossover variable is applied or changed.
Configuration
To set a crossover variable:
- Click the crossover variable button in the dashboard toolbar.
- In the crossover dialog, select the question you want to use as your crossover variable (e.g., "Product").

- Click apply. The dashboard will refresh to show crossed data for all questions.
What you see
Cross-variable distributions
The dashboard displays an overview showing how responses are distributed across the categories of your crossover variable.

Per-question data
For each question in your dashboard, you will see:
Data table
A table showing statistics crossed by the variable, including:
- Top box scores
- Low box scores
- Mean values (for scaled questions)
- Statistical significance indicators showing which differences between groups are statistically significant
Chart (if enabled)
If charts are enabled in the block configuration, a chart displays data for each category of the crossover variable.
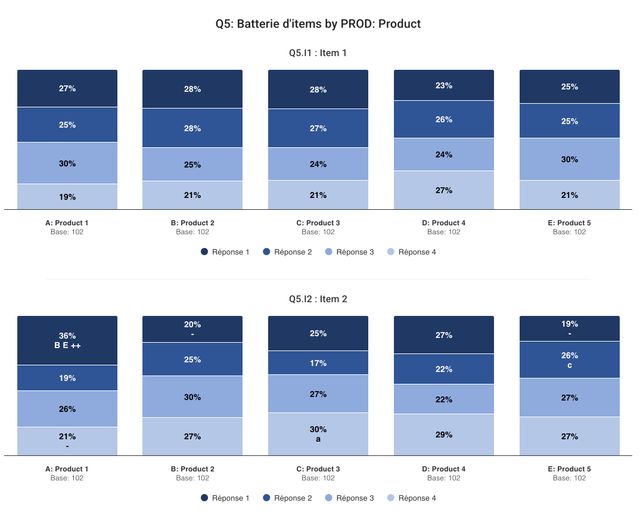
Distributed chart
For questions with multiple response options, a horizontal chart shows the distribution across crossover categories.


For multiple-choice questions, the horizontal distributed chart is particularly useful for comparing response patterns across groups.
Display TopBox/LowBox/Mean
You can choose to display TopBox, LowBox, or Mean statistics in the data table for each question block. This is configured in the block settings.

Examples
Example scenario: You select "Product" as the crossover variable. Your dashboard contains satisfaction questions, NPS, and demographic data. Each question now displays:
- A table with satisfaction scores for Product A, Product B, and Product C.
- Charts comparing how each product's users responded.
- Distribution charts showing response patterns side by side.
This allows you to quickly identify which product performs better on specific metrics.