Raking
Raking adjusts the weight of survey responses to match a target distribution, ensuring your sample reflects known population characteristics. This improves the accuracy of your survey results when your sample differs from the actual population.
Definition
Raking (also called sample balancing or rim weighting) is a weighting technique that adjusts response data so specific variables match predetermined target distributions. When you rake by a question such as "Product," you specify what percentage of responses should come from each product category, and the system recalculates weights accordingly.
When to use
Use raking when:
- Your sample distribution does not match the known population distribution.
- You need to correct for over- or under-representation of certain groups.
- You want to ensure your results reflect real-world proportions.
Avoid raking when your sample already closely matches the population or when you lack reliable target distribution data.
Key behaviors & constraints
- Only one raking configuration can be active at a time.
- Raking applies to the entire dashboard.
- All statistics, charts, and tables update automatically when raking is applied.
- You can reset weighting to remove raking adjustments.
- Target percentages must sum to 100%.
- Raking does not change the underlying response data, only how responses are weighted in calculations.
Configuration
To apply raking:
- Click the raking button in the dashboard toolbar.
- In the raking dialog, select the question you want to rake by.

-
For each response option, enter the target distribution percentage or permille if you enable the option.
-
Click apply to activate the raking.
Example configuration
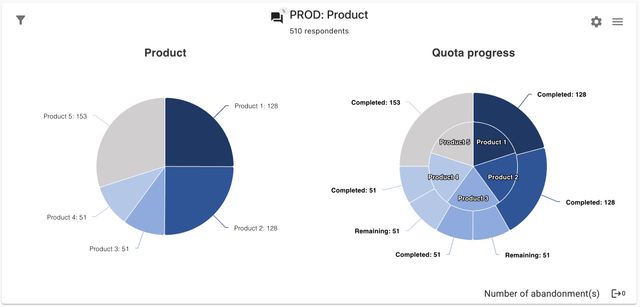
To rake by "Product" with the following target distribution:
- Product 1: 25%
- Product 2: 25%
- Product 3: 10%
- Product 4: 10%
- Product 5: 30%
Enter these percentages in the raking dialog. The system will adjust response weights so the effective sample matches these proportions.
Resetting weights
To remove raking and return to unweighted data, click the reset weighting button in the toolbar.

All dashboard data will revert to the original, unweighted values.
Examples
Scenario: Your survey has 1,000 responses, but Product 5 represents only 15% of responses while it accounts for 30% of your actual customer base. By raking to 30%, responses from Product 5 users receive higher weight, and responses from over-represented products receive lower weight. This produces statistics that better reflect your true customer population.
Combined with filters: You can apply filters before raking. For example, filter to "Region: North America" then rake by "Product" to ensure the North American sample matches the regional product distribution.