Results
Once your project has been processed, you can access and explore your results using the R3M platform’s interactive dashboards. These dashboards provide a detailed view of emotional activation scores, key words, and comparative analytics for your tested stimuli.
Accessing your results
- Go to your project and click VIEW RESULTS.
- The platform will display the main dashboard, where you can see all your stimuli and their associated R3M scores.
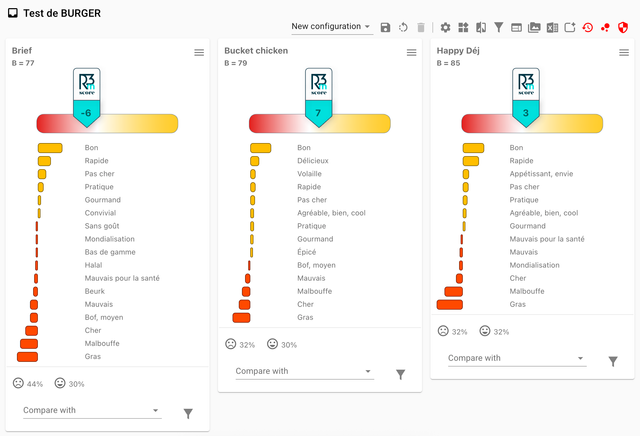
Understanding the dashboard
The dashboard provides a comprehensive overview of your project’s findings:
- Stimulus cards: Each card represents a stimulus (e.g., product, concept) and displays its R3M score, key words, and other indicators.
- Bar sizes: The size of each bar reflects the importance (contribution) of a word to the overall score.
- Colors: Yellow bars indicate positive scores; red bars indicate negative scores.
- Icons: Visual cues highlight significant differences, strengths, weaknesses, and unique characteristics compared to benchmarks or other stimuli.
Key metrics
- R3M score: The total emotional activation score for each stimulus.
- % Lovers: Percentage of respondents with a highly positive R3M score (> 30).
- % Rejectors: Percentage of respondents with a negative R3M score (< 0).
- Word details: Hover over bars to see the score and number of mentions for each word or group of words.

Comparative analysis
- Use the Compare with feature to benchmark a stimulus against the average or another specific stimulus.
- Filter results by demographic or custom criteria to analyze subgroups.
- Switch between Normal and Synthesis display modes for detailed or summary views.
Tips for interpreting results
tip
Look for high R3M Scores and a high percentage of Lovers to identify strong, positive emotional activation. Pay attention to negative scores and Rejectors to spot potential issues or polarizing elements.
You can now proceed to deeper analysis, filtering, and exporting your results as needed.