Display modes
The R3M platform offers several display modes to help you analyze and interpret emotional activation results, each providing a different perspective and level of detail.
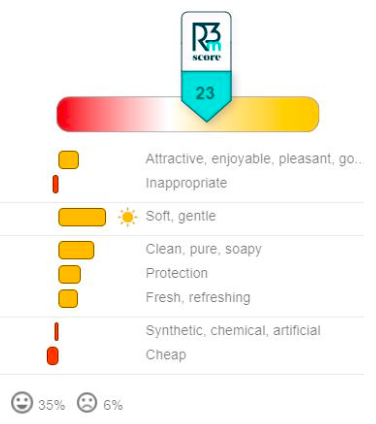
Normal mode
- Detailed map: Each stimulus card displays the R3M score along with detailed word-level results.
- Word details: See the contributing words or word groups, their scores, and other key indicators.
- Additional questions (optional): If your data includes extra survey questions or filters, their results can be displayed alongside the main R3M metrics.
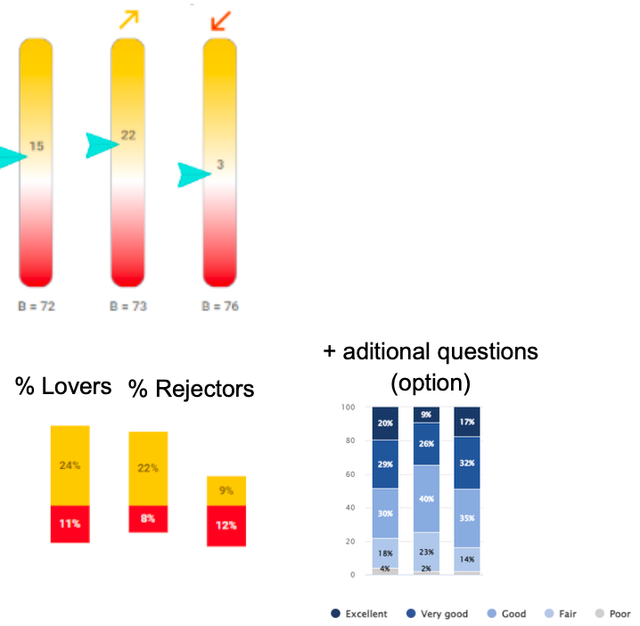
Synthesis mode
- Overview: Presents a summary view of R3M Scores and key indicators (such as % Lovers and % Rejectors) for each stimulus.
- No word details: Only overall R3M scores and summary statistics are shown—word-level details are hidden for a high-level comparison.
- Additional questions: Shows percentage distribution for filters and other survey questions if included in your data.
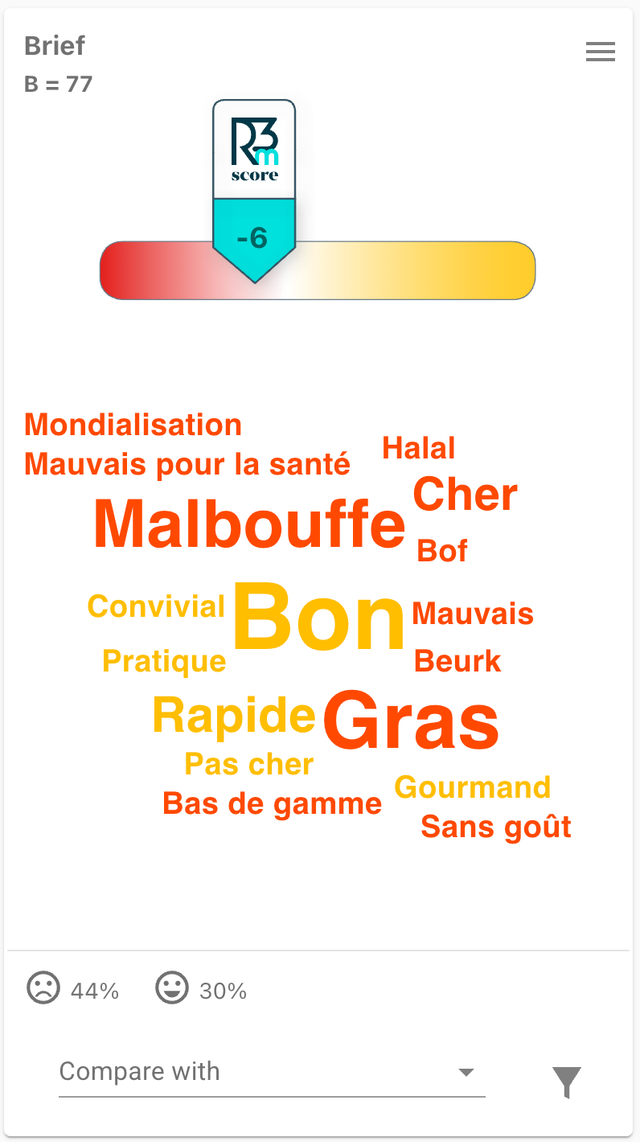
Tag cloud view
- Visual word emphasis: Displays the most impactful words as a tag cloud, where the size of each word reflects its importance or frequency in the responses.
- Quick insights: Instantly spot which words or themes dominate the emotional landscape for each stimulus.
- Ideal for: Presentations or when you want a fast, visual summary of key emotional drivers.
Analytics dashboard
- Sub-target synthesis: View R3M Scores by subgroups (e.g., age, gender) in a comparative table or chart.
- Switching views: Easily toggle between Normal, Synthesis, and Tag Cloud modes to adjust the level of detail according to your analysis needs.
tip
Use normal mode for in-depth analysis, synthesis mode for high-level overviews, and tag cloud view for a quick visual summary of dominant emotional themes.