Read R3M card
Each stimulus in your project is visualized as a R3M card on the dashboard. These cards provide a detailed summary of the emotional activation results for each stimulus, including scores, key words, and comparative insights.
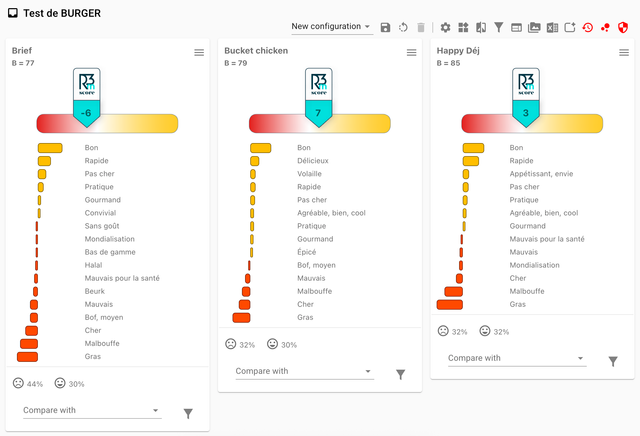
Main elements of a R3M card
- Stimulus name: The name or identifier of the tested stimulus.
- Base (B=xxx): Number of respondents who evaluated this stimulus.
- R3M score: The overall emotional activation score for the stimulus.
Word bars
- Bars: Each bar represents a word or group of words that contributed to the R3M score.
- Bar size: Indicates the intensity or importance of the word’s contribution.
- Bar color:
- Yellow: Positive score
- Red: Negative score
- Hover function: Move your mouse over a bar to see its score and the number of occurrences.
Comparison and icons
- Comparison pictograms: If the “comparison” option is on, pictograms show significant gaps versus a point of reference (e.g., average or another stimulus).
- Arrows: Indicate if the score is significantly higher or lower than the reference.
- Icons:
- Yellow sun / red cloud or green/red thumbs indicate strengths and weaknesses compared to the benchmark.
- “Diamond” words: Words below the display threshold but specific to this stimulus (minor strengths).
- “Missing” words: Words below the display threshold but with a significant difference versus comparison (gray pictogram).
Key metrics
- % Lovers: Percentage of respondents with R3M score > 30 (highly positive).
- % Rejectors: Percentage with R3M score < 0 (negative).
- Filtered sub target: Optionally, results can be filtered to show specific subgroups (e.g., age, gender).
Additional features
- Grouping by theme: Words can be grouped around the same topic (e.g., “herbal, woody”).
- Apply filters: Use filters to refine the displayed results by criteria such as demographics or product attributes.
tip
R3M cards allow you to quickly see which words and themes drive emotional activation, identify strengths and weaknesses, and compare stimuli against benchmarks or other products.