Analytics
The analytics features in the R3M platform allow you to synthesize and compare emotional activation results across different subgroups or targets. This is especially useful for understanding how different segments respond to your stimuli and for identifying significant differences between groups.
Synthesis among targets
- Automatic synthesis: In the Analytics tab, you can view a synthetic and analytic summary of R3M scores among sub-targets (such as age groups, genders, or other filters).
- Comparison methods:
- Between stimuli: Compares the R3M scores of each filtered stimulus versus the filtered total.
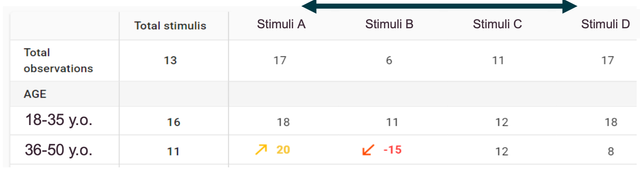
- Between targets/filters: Compares R3M scores between several subgroups or filter values.
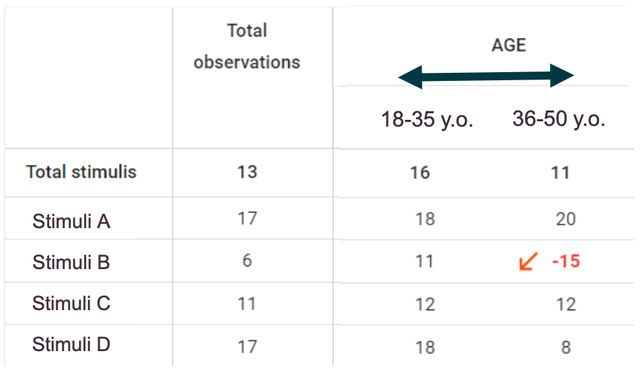
Using the analytics table
- Interactive table: Move your cursor across the R3M scores to view the sample size (basis) and p-value for each cell. If the basis is less than 5, the score is not calculated (n/a).
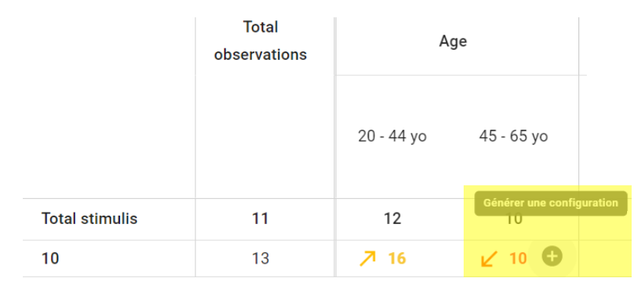
- Automatic configuration: When a significant difference is detected, a "+" appears in the table. Click it to automatically generate and save a new configuration focused on that comparison.
Manual comparison
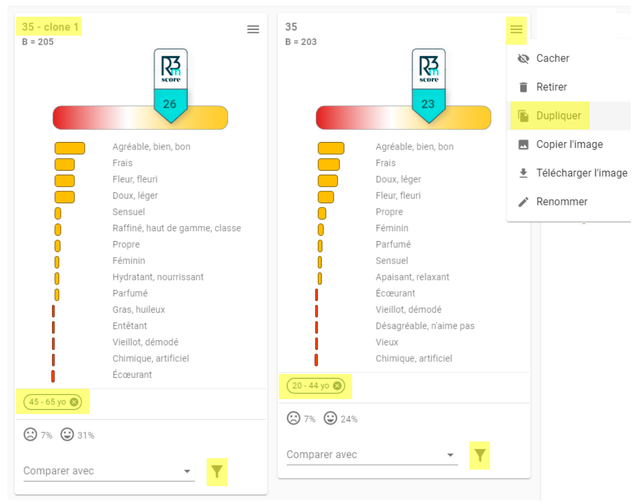
- Duplicate cards: Clone a card to compare the same stimulus across different subgroups (e.g., age groups, countries).
- Apply filters: Filter each card by the sub-target of your choice, then use the comparison feature to highlight differences.
tip
Analytics allow you to quickly spot significant differences between subgroups, understand what drives positive or negative outcomes, and generate actionable insights for targeted improvements.