Comparison
The R3M platform offers robust comparison features, allowing you to benchmark stimuli against each other or against the overall average. This helps you quickly identify strengths, weaknesses, and unique characteristics in your results.
Comparing stimuli
- Compare with: Use the Compare With menu to select a reference point for your comparison. You can compare a stimulus to:
- The TOTAL (average scores of all stimuli)
- A specific stimulus (e.g., a current formula, initial situation, or another product)
- Single card comparison: You can also compare just one card by clicking “compare with” at the bottom of the card.
Visual indicators
- Arrows: Indicate significant superiority or inferiority versus the reference point.
- Icons:
- Yellow sun / red cloud or green/red thumbs show strengths and weaknesses compared to the benchmark.
- Diamond words: Words below the display threshold but specific to this stimulus (minor strengths).
- Missing words: Words below the display threshold but with a significant difference versus the comparison (gray pictogram).
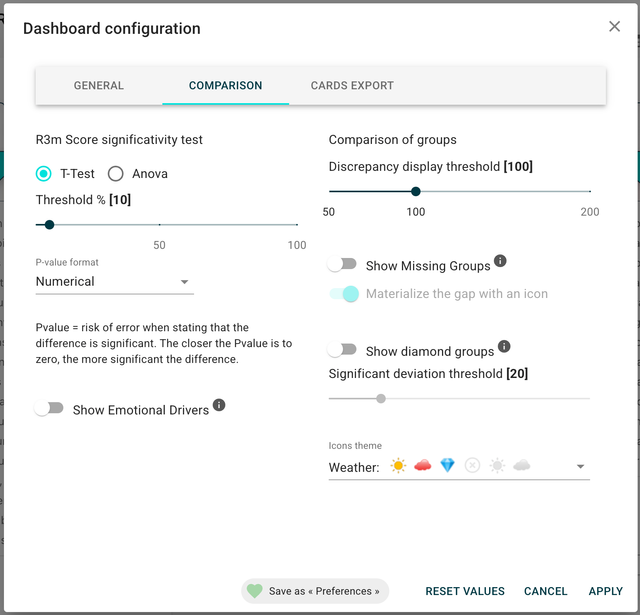
Comparison settings
- Customize icons: Choose different icons to display differences between stimuli.
- Display options:
- Show or hide missing words and diamond words.
- Set thresholds for displaying differences and significance (e.g., T-Test at 10%).
- Choose p-value format (numerical or percentage).
Saving and managing comparisons
- Save configurations: Save your comparison setup for future reference.
- Reset or delete: Return to the initial configuration or remove saved setups as needed.
tip
Use comparison features to highlight what makes each stimulus stand out, and to focus your analysis on the most meaningful differences.