Card display settings
The R3M platform offers a variety of settings to customize how cards are displayed on your dashboard. These settings help you tailor the visualization of emotional activation results to your analysis needs and presentation preferences.
Accessing card display settings
- Go to Dashboard settings (menu in the top right-hand corner of the dashboard).
- Most card-related options are found under the General tab, but some are in the Comparison and Cards export tabs.
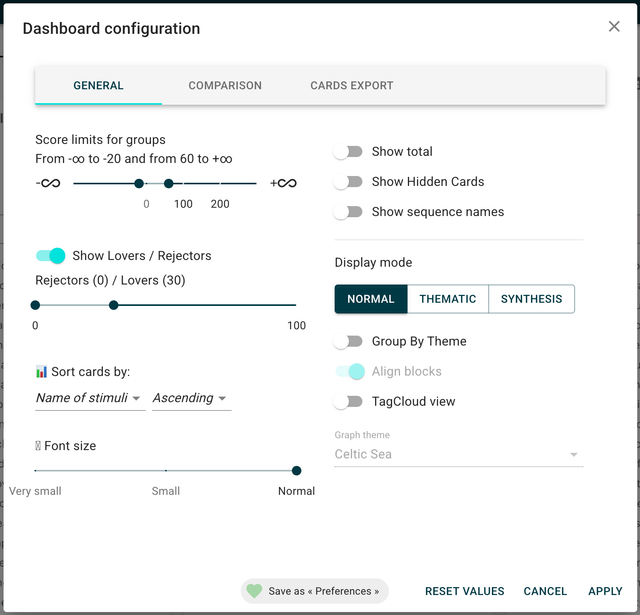
General card display options
Display total
- Show or hide the TOTAL card, which represents the average score of all stimuli.
- Useful for benchmarking individual stimuli against the overall average.
Sorting cards
- Order cards by:
- Name
- R3M Score
- Base number (number of respondents)
- % Lovers
- % Rejectors
- Choose ascending or descending order.
Font size
- Adjust the font size for stimulus names and displayed words on cards for better readability.
Save dashboard preferences
- Save your dashboard settings as your default view. Each user can have their own preferences.
Display modes
Normal mode
- Shows detailed word-level results for each card.
Thematic mode
- Group words by themes for a broader view of emotional territories.
- When activated, cards display overall thematic groups instead of individual words.
- Option to align blocks for all cards, which can improve comparison but may take up more space.
Synthesis mode
- Displays only the total R3M score and % Lovers/Rejectors, hiding word-level details for a cleaner summary.
Score display settings
Score limits
- Set the minimum and maximum score limits for display (default: -20 to +60).
- Adjust to +50 or +40 to display more words on the card if needed.
Lovers / rejectors thresholds
- Lovers: Default threshold is R3M Score > 30 (can be changed to 40 or higher for atypical score distributions).
- Rejectors: Default is R3M Score < 0.
Card visibility and sequence names
Display hidden cards
- Show cards that have been hidden from the dashboard (e.g., by user action).
Display sequence names
- If your project includes multiple sequences (e.g., waves, countries), you can display the sequence name on each card to distinguish between them.
Comparison and icon settings
- Icons: Choose which icons to use for visualizing differences (e.g., sun/cloud, thumbs up/down).
- Display missing words: Show words below the display threshold if they have a significant difference versus the comparison item.
- Display diamond words: Show words that are below the main display threshold but are specific to a stimulus (minor strengths).
- P-value format: Choose between numerical or percentage display for significance tests.
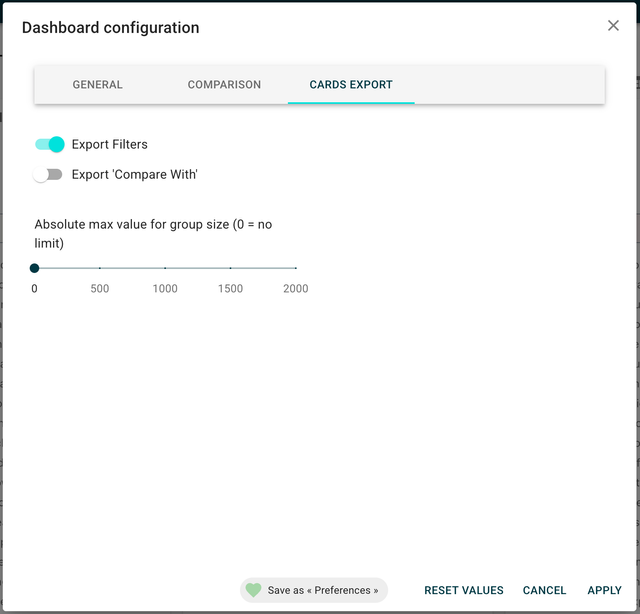
Export settings
- When exporting cards as images, you can choose which configuration elements (filters, comparison criteria) to include.
- Absolute max value for bar size: Adjust if a word has a very high score that flattens other bars, to rebalance the display.
tip
Customizing card display settings helps you focus on what matters most in your analysis and ensures your results are clear and impactful for your audience.